
Building a Live Firewall Attack Map
(if you’re just looking for the map, it’s here)
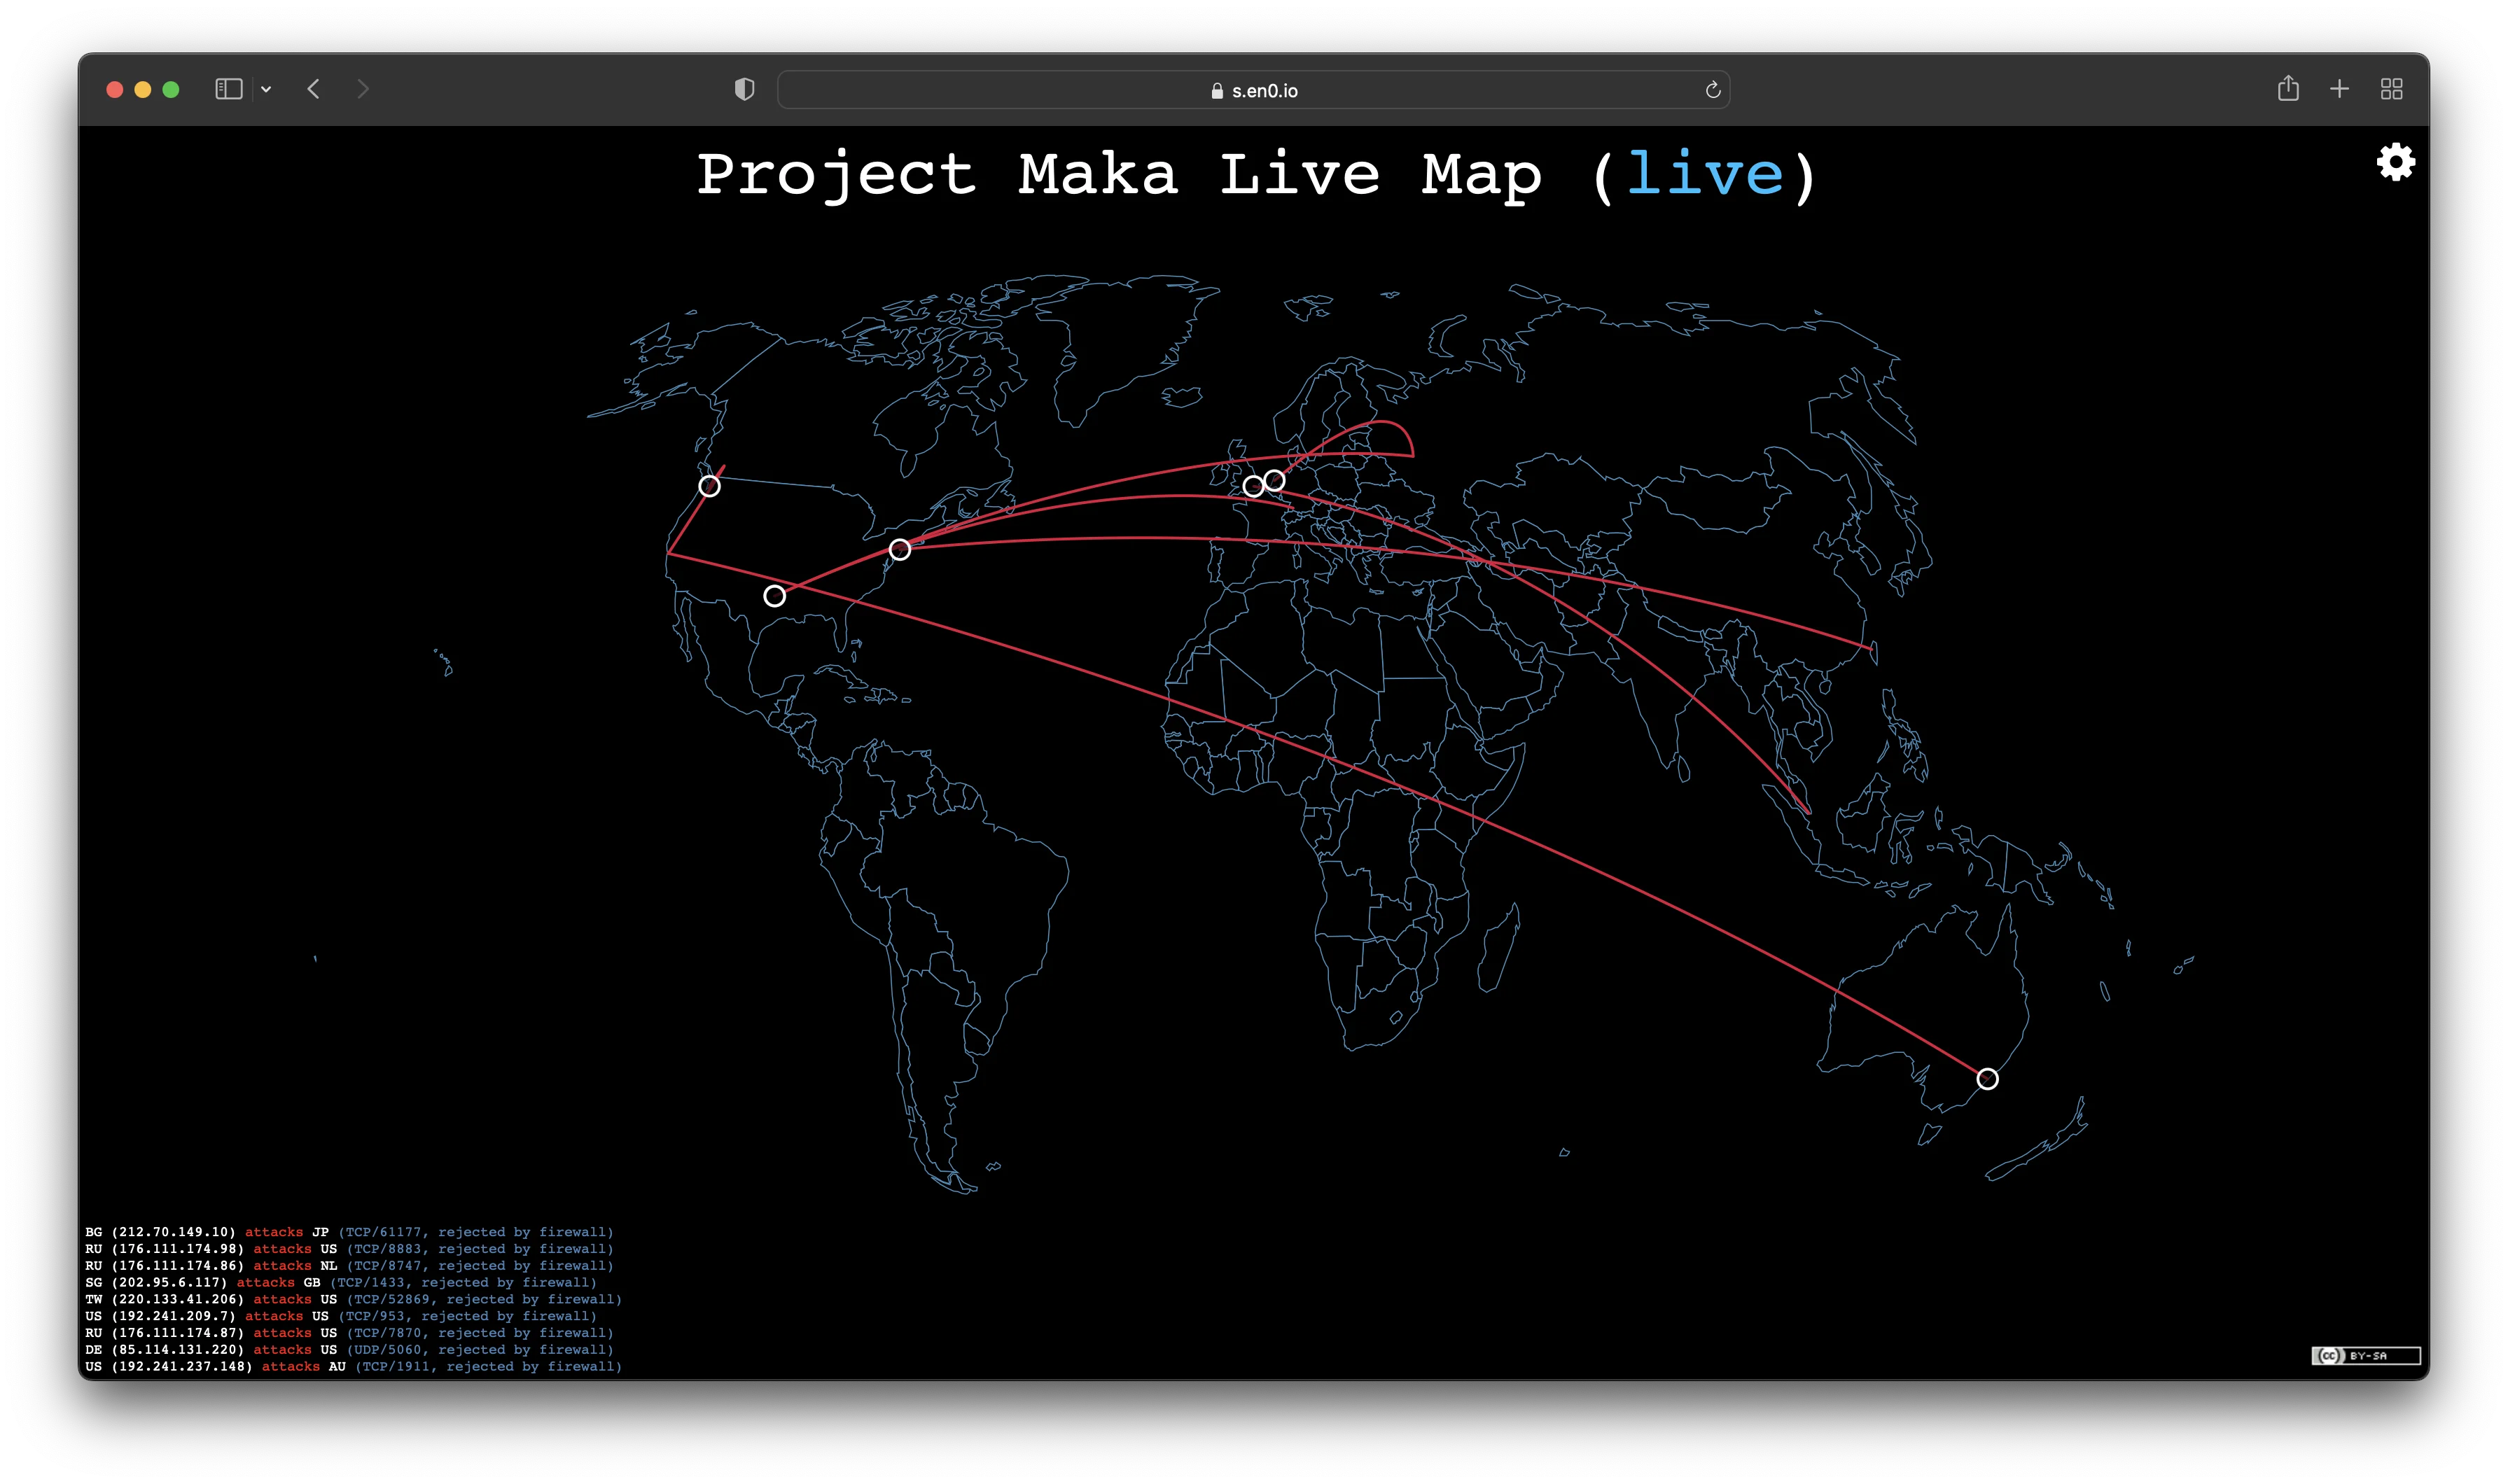
For the last few years, I’ve ran https://s.en0.io, collecting metadata about blocked firewall traffic from all of my physical servers and VMs around the world. It’s not a particular useful pursuit, but I have the resources for it so why not?
There’s a simple Python agent that runs on the servers (github), tracking their ufw logs and Fail2Ban logs and feeding it to an API endpoint, where it’s processed, logged and reported to AbuseIPDB if it meets certain criteria. The main backend isn’t currently available anywhere because the code is far too ugly to post somewhere and allow to be associated with me. Maybe one day.
Anyway, over the years at conferences I’ve seen companies show off their cyber attack maps. They’re pretty much exclusively to impress potential clients with flashy lights, and they serve no real purpose.
But what if I made my own useless map using my data?
Back in 2014, Bob Rudis (currently VP of Data Science at GreyNoise and hrbrmstr on GitHub) and Alex Pinto (alexcpsec@) released the IPew Attack Map on GitHub under CC BY-SA 4.0 (admittedly a strange choice for software). It’s a cyberattack map that generates fake attacks randomly based on some statistical models with a load of comical sound effects. Most importantly, his map is easy to customize. But we’re getting ahead of ourselves. First we have to figure out how to get data to the map.
The Backend
I won’t cover the entire backend in-depth here since it’s not the main focus of this post, but I may cover it in a future post.
The backend for https://s.en0.io is written in PHP, which doesn’t lend itself to doing “real-time” things like websockets, so we’ll need to find a way to get live data to something that can. Message queues are handy for this, and in my case we’ll be using RabbitMQ with PhpAmqpLib (github). I created a new controller appropriately called “QueueController”. It receives only a handful of things from the main logging controller: the source address, the destination address, the protocol, the destination port and a message describing the traffic.
If the destination address is RFC1918 space (comes up a lot in 1:1 NAT situations and with EC2 instances), it
automatically assumes the destination IP to be the value of $_SERVER['REMOTE_ADDR'] (PHP’s variable for the client
making the request). The source and destination addresses are queried against a local copy of the MaxMind GeoLite2-City
database, which returns a latitude and longitude for each. All of this data is imploded to a CSV string (a tiny bit less
network overhead than JSON), and fired off to a RabbitMQ queue. It contains:
source IP, ISP name, source latitude, source longitude, source country code, destination latitude, destnation longitude, destination country code, protocol, destination port, message
91.240.118.53,,22.2578,114.1657,HK,47.6034,-122.3414,US,TCP,12311,rejected by firewall
Currently, the ISP field is blank because unfortunately I cannot afford a license to GeoLite2-ASN.
Once the CSV is added to the queue, NodeJS script called pewpew-ws-server (github) consumes and acknowledges the messages. It’s a very basic script, coming in at only 44 lines. It runs a listener for socket.io, and emits every CSV it gets over the websocket server.
The Frontend
I modified hrbrmstr’s map source code, except that the vast majority of the original javascript code has been removed (however much of the original HTML remains). The only remaining scripting from the original implementation is the FixedQueue functions, the DataMaps initialization, the drawHit() function, the pushToAttackDiv() function and the modal. Almost all the rest of the code was related to generating fake attacks, and was unnecessary.
The Datamaps library also conveniently supports just being fed a latitude and longitude with no extra shenanigans. I was really expecting to have to process the geographic coordinates to canvas coordinates or something, but it just worked out of the box.
I added the socket.io listener, and added calls to drawHit() and pushToAttackDiv() to the listener.
var socket = io("https://" + window.location.hostname);
    socket.on("alert", (message) => {
        console.log(message.event_data);
        pushToAttackDiv(message.event_data);
        drawHit(message.event_data);
    })
I also added my own color logic to the drawHit() function. If it’s in rainbow, it’ll cycle through colors and if it’s in default, it’ll show firewall blocks in red, Fail2Ban “found” events in light blue and Fail2Ban “ban” events in purple.
I also removed all the default sounds that were included and created a generic “blip” in Audacity. Sound is also disabled by default and is toggled via a button in the modal because I can’t stand autoplaying sounds.
Final Thoughts
I’ve got probably 98% of what I want to implement there, but I’ve got a few things left to resolve. I’d like to display the ISP name on the scrolling feed, but first I either have to build a cache for something like IP-API or run and cache whois records. I certainly don’t want to be paying MaxMind $25/month for a silly side project.
I think I have also broken something in the modifications, as the bubble hovers only show the data from the most recent bubble. I’d also like to redo the front-end a bit as it feels a bit… bland?
I may also start recording and displaying events from web server logs where clients will try to request URLs that are long strings of hex code attempting to exploit RCE vulnerabilities.
I also need to start pruning old events from the attack feed div; eventually it’ll make the page large enough it crashes the browser tab.
From having a tab with the map open side-by-side with a terminal showing the incoming log events, the latency from firewall hit to being drawn on the map is typically less than half a second.
Links
- hrbrmstr and alexcpsec’s IPew Map (github.com/hrbrmstr/pewpew)
- Main firewall logging site (s.en0.io)
- My live map (s.en0.io/map)
- pewpew-ws (github.com/en0io/pewpew-ws)
- pewpew-ws-server (github.com/en0io/pewpew-ws-server)
- maka-agent (github.com/en0io/maka-agent)
- maka-webapp (no source available at this time)


